
Infographic Illustration Services

Custom Infographic Illustrations for Engaging Data Visualisation
I create clear, engaging infographic illustrations that turn complex data into visuals people want to look at - from diagrams and charts to graphs and pictograms.
Ideal Applications…
Annual reports
-
Internal Communications
-
Awareness Campaigns
-
Investor Pitches
-
Business Strategy Visuals
-
Website Enhancements
-
Employee Handbooks
-
Annual reports - Internal Communications - Awareness Campaigns - Investor Pitches - Business Strategy Visuals - Website Enhancements - Employee Handbooks -
Visualise more than just data! Infographic illustrations will help make your business:

Relatable
Charm audiences with playful visuals that connect emotionally to humanise your brand.
Accessible
Deliver data fast and make audiences receptive to what you have to offer.

Distinctive
Make a brand statement - by giving your audience unique art instead of another dull chart.
Handcrafted feel, pixel-perfect delivery!
Through my process, I blend the warm creativity of handmade design with the adaptability of digital methods; resulting in infographics that truly connect and engage.
Your infographic arrives in digital format, so you're all set to share your visual story wherever your wherever your audiences are.

Data Doesn't Have to Be Dull

Overly plain graphics can backfire into boredom
My infographic illustrations break free from boring charts with:
Nostalgic Reboot - Vintage textures and old-school imagery that transforms data from dry to delightful.
Visual Breathing Room - Hand-drawn letters and intuitive shapes that make information feel relatable and memorable.
Unlimited Data - Illustrations that leap beyond diagrammatic design constraints, innovating with visual storytelling and pictorial problem solving.
Infographic illustrations engage the eyes to access the intellect!
Some infographic approaches to consider for your project:
Cultural and Conceptual Infographics
Hand Lettered Diagrams: I turn traditional diagrams into lively visual stories with hand lettering and vintage textures. Capturing attention and driving engagement so that your message lands with impact.
A hand lettered Venn diagram using colour to visualise overlaps in heritage, accent and culture:

Colour Coded Diagrams: With colour know-how, I codify information for effortlessly absorption. Using logic, comparison and sometimes humour, I provide visual reasoning with a light touch!
A diagram that uses colour logic to demonstrates why purple is a diplomatic choice for Liverpool’s wheelie bins:

These infographics stood out and provided fast visual clarity in an information-rich page. See the project in full here

Cross Section Illustrations and Cutaway Illustrations
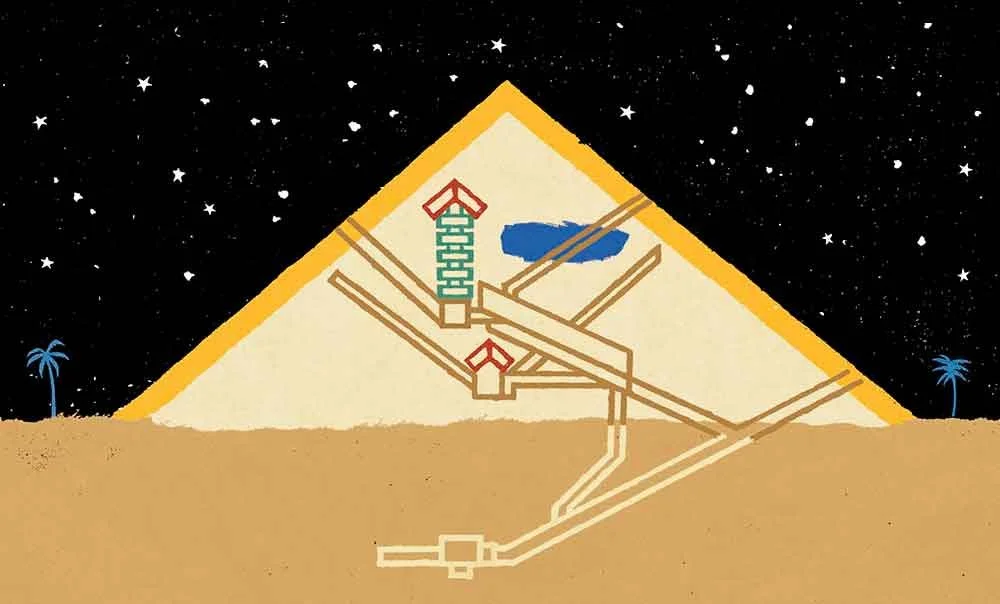
Step Inside! My cross-section illustrations reveal the hidden interiors of structures and objects to make the unseen visible…
Enigmatic void inside the Great Pyramid anyone?!
By using modular forms and curated colour, I distill detail; simplifying information so it’s easy to grasp. Vintage textures inject vibrancy to create an outcome that’s organised and functional but never too formal.
Explore more illustrations from this publishing project here


Illustrated Process and Workflow Infographics
These infographic examples, quite fittingly, illustrate the processes of illustration itself!
My 'How It Works' diagrams depict processes and workflows to help facilitate optimal user experiences.
Through visually appeal, they make complex procedures understandable at a glance; and function as stand-alone images
So, if you are curious about the process of bringing infographic illustration into your project, you’re welcome to take a look!


Ready to transform your data into engaging visuals?
Contact me to discuss your custom infographic illustration project!